How to use Google Analytics to improve your small business
Data is a valuable commodity these days – learning what your customers do and what they want is one of the best ways to improve your business. One great way is by analysing the visitors on your website and conveniently, there is a free way to do it via Google Analytics.
The downside is that Google Analytics (GA) will give you so much data you might get overwhelmed. We’re a small business, so we completely understand how pressed you are for time, so that’s why we’re going to show you how to focus on the important bits.
In this blog, we assume you already have a GA Universal Analytics account set up and have created at least one ‘goal’ (an action that is important to you, for example a purchase or contact form send). If you don’t have these, there are lots of great tutorials online, or ask your web developer to do it for you.
All done? Here’s how to start analysing.
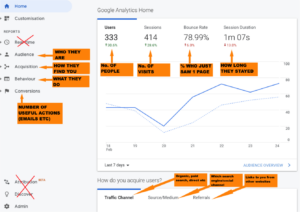
When you open GA you will see this screen, with a chart of the past 7 days and a sidebar with different headings that can seem confusing. Here’s a slide giving a bit of explanation about those headings so you don’t waste time hunting for data:

1. How do your users find you?

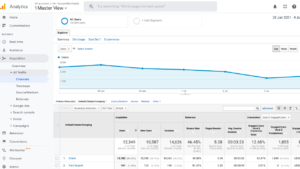
For this, you need to choose Acquisition in the sidebar and then All Traffic/Channels. This is one of my favourite pages and gives you a breakdown of the main ways (channels) people have found your website. The time period is usually a week, but you can change it in the top right hand corner.
There are quite a few channels, but the most important ones are:
- Direct (sometimes called (None)): Generally this is people who have found you by using your URL
- Organic: using a search engine, either your company name or a more general search
- Paid search: Google Ads etc.
- Referral: A link to your site from another website, for example it could be a directory, a news story or one of your suppliers
- Social: social media
This can be handy because:
You can see which channel is the most important and which might need improvement. Take a look at how each channel performs compared with the others, especially in the right hand column, which is where the result of your goals will be listed, as ‘conversions’ (ie users who have converted to leads/customers). Maybe some channels see lots of clicks but few conversions, while others are the other way round. Are you strongest on social media? Or is it organic search that is best? Use this info to focus your marketing efforts.
2. How to track performance of marketing/adverting campaigns
As well as showing how your users find you (see previous question) the Acquisition/All Traffic/Channels page also lets you monitor changes when you do advertising or marketing, because it shows you if there is an increase in users across your channels.
This can be handy because…
You can get an at-a-glance overview of the impact of marketing. For a Google Ads campaign, you’d expect to see an increase in Paid Search, if you did a radio campaign you would expect increases in Organic Search (because people are looking for you online), for email campaigns you’d probably see an increase in the Referral channel if people have clicked on an email link, and for leaflets you would expect more Direct users because they have seen your URL and found you by typing it in.
Google isn’t perfect in categorising users so increases might be in other channels as well, but the bottom line is if your marketing has worked, you should see overall user numbers increase. If that has happened, great – but has it actually led to good results? Look at the right-hand column where you can see your goal conversion data. If you are using Google Ads, you can also look at Acquisition/Google Ads/Campaigns for more in-depth detail.
3. Which pages/products get the most visitors?

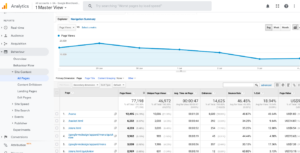
To find out which pages are doing best, you need to go to Behaviour/Site Content/All Pages. This overview gives you the top 10 pages (there’s also an option to see all the pages by clicking in the bottom right-hand corner). Here you can see not only the number of views of each page on your site, but also the average time spent on it and other data.
This can be handy because…
You can check that all your most important website pages are being visited. Take a look at your top 10 pages. Are there any important pages on your site that are missing from the top 10? If so, ask yourself why and make changes accordingly. Say you sell lots of women’s clothes but only the men’s section is popular. Perhaps the Women page isn’t easy to navigate to, or perhaps your marketing has made you more of a men’s brand. Either way, it gives a focus for improving your business.
If you sell products or services, you can also use this overview to see which items get lots of page views, but few sales (conversions). Perhaps the description or photo need to be improved, or maybe what you are selling is just too expensive – it’s definitely worth looking into, because you clearly have an interested audience, and with a little extra work on that page you might be able to increase your sales or leads.
4. How to find pages that need improvement
Stay on Behaviour/Site Content/All Pages and take a look at the Bounce Rate column. This shows the percentage of people who left a page on your site without viewing any other pages on your site. Also interesting is the %Exit column, which shows the percentage of people who had that page as their last (it wasn’t necessarily their first page as well, which is why the Bounce Rate and Exit Rate figures are different).
This can be handy because…
You can find pages that people don’t like. Blog pages often have a 90%+ bounce rate because people usually come to read specifically about the blog topic and don’t explore your site further, but your home page and other key pages should be in the region of 35-60%, depending on the type of business you have. A figure above this range suggests that some work is needed to help engagement, perhaps a ‘read more’ link or better text or pictures (note: page load speed can also be a huge factor – if it’s more than a couple of seconds, this can result in a very high bounce rate because people can’t be bothered to wait for your site to appear).
Likewise, some pages always have high exit rates (eg. a transaction completed page) because people naturally have to leave a website somewhere. But if it’s a product page, check it out – why don’t they want to buy?
5. Ideas to grow your business

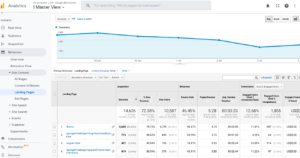
Another favourite page of mine is the Behaviour/Site Content/Landing Pages overview page. In here, there is a list of the first pages that people saw on your site. It can be a surprise that many of your visitors didn’t see the Home page first – it also means that all the careful messaging about your business that you created for the home page might be missed.
This can be handy because…
You can see which pages are helping people find your business. This is great because the hard work of getting visitors has been done, and now there is a chance to optimise. Visit each of the pages in the top 10, imagining you are your customer. Do the pages tell people about your business? Do they encourage them to buy/contact you/read more on your site? If not, make a few updates to the page content to help them do these things.
What next?
We are often asked ‘what’s a good conversion rate/bounce rate/exit rate etc?’ There isn’t a straightforward answer because these figures depend on so many things, including the industry you are in, what you are trying to achieve and what you offer on your website. So what we suggest is to forget trying to measure yourself against others or aiming for a specific figure and instead aim for incremental improvement on your own data. Good luck – and if you need a hand or a developer to do some bits for you, please get in touch.
